If anything has defined the last several months in global trade, it’s been uncertainty disguised as stability.. Importers in the US have been cautiously optimistic on hearing the 90-day US–China tariff truce, hoping that the worst of the tariff hikes were behind them..
There is a sense of false calm based on the news that the US will reduce tariffs on Chinese goods from 145% to 30% in exchange for China lowering tariffs on US imports from 125% to 10%..
But in reality, that truce has only masked a much more complex, layered, and expensive tariff landscape still at play—one that is quietly eroding the margins of those who aren’t paying close attention..
Far from disappearing, it appears tariff complexities are taking a different form, particularly around Section 301 duties, IEEPA surcharges, and Section 232 material-specific add-ons.. While some headlines have shifted focus, the real cost burdens continue to mount in the background..
“Importers — don’t be fooled. The true cost of tariffs is much higher than 30%” – this is the warning from Keith Schwartz, CEO of Nicole Brayden Gifts..
In a compelling LinkedIn post that has rightly attracted industry attention, Keith Schwartz, CEO of Nicole Brayden Gifts, breaks down the reality behind what many believe to be a “30% tariff environment” – Spoiler: it’s not 30%.. Not even close in many cases..
His breakdown..?? A sobering calculation that shows how the actual tariff burden, especially on products involving steel, aluminium, or falling under earlier tariff lists, can quietly climb to 80–90%, and in some cases even higher..
What’s going on..??
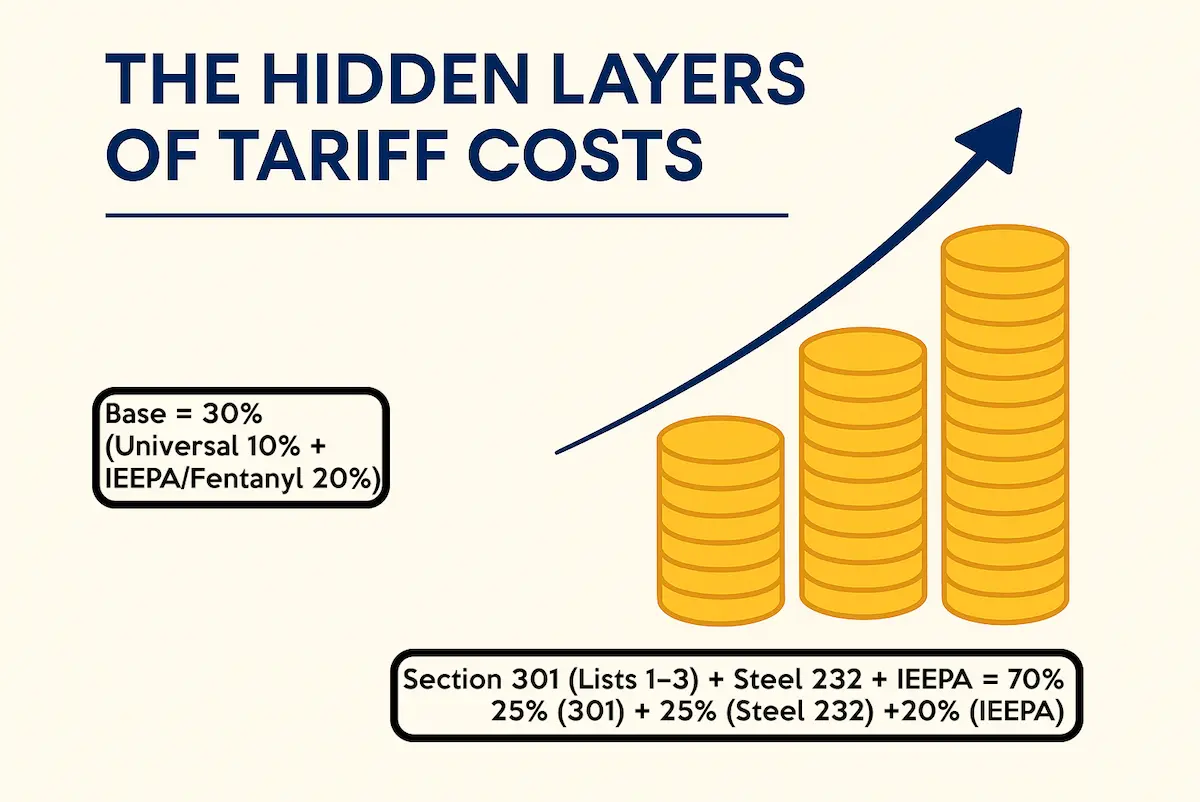
Keith outlines the layered nature of today’s U.S. tariff structure on imports from China:
Tariffs are stacking, and depending on the country of origin, HTS classification, and material content (like steel or aluminium), the real impact is 40% to 90% or more.
China – Stacked Tariffs Breakdown
Base (Reciprocal + IEEPA/Fentanyl):
➕ +10% (Universal Tariff)
➕ +20% (IEEPA/Fentanyl)
✅ = +30%
With Section 301 (Lists 1–3):
➕ +25% (301)
➕ +20% (IEEPA)
➕ +10% (Reciprocal)
✅ = +55%
With Section 301 (List 4):
➕ +7.5% (301)
➕ +20% (IEEPA)
➕ +10% (Reciprocal)
✅ = +37.5%
If item contains steel (232 duties apply):
➕ +25% (Steel 232)
➕ +20% (IEEPA)
✅ = +45%
Section 301 (Lists 1–3) + Steel 232 + IEEPA:
➕ +25% (301)
➕ +25% (Steel 232)
➕ +20% (IEEPA)
✅ = +70%
Section 301 (List 4) + Steel 232 + IEEPA:
➕ +7.5% (301)
➕ +25% (Steel 232)
➕ +20% (IEEPA)
✅ = +52.5%
🔍 Bottom Line: If your pricing model assumes “just 30% tariffs”, you’re underestimating your landed cost — often by 20–40 percentage points.
Keith Schwartz says, “With freight costs rising, your real all-in landed cost could easily reach 50–90%+. These higher costs are especially true for products that contain steel or aluminium, which trigger 232 tariffs. Be careful in your costing because you may get a bill that you didn’t expect!”
Final thoughts – visibility isn’t just digital, it’s fiscal
In the age of digital supply chains, we often speak about data visibility, predictive analytics, and real-time tracking.. But fiscal visibility—understanding what you’re actually paying, why you’re paying it, and how to legally reduce it—is just as vital..
As Keith Schwartz’s insights so clearly show, 30% may be the headline, but 90% is often the footnote.. And that footnote is where many importers will either bleed cash or regain control..
The lesson here..?? Never assume your tariff obligations are straightforward.. The world of trade policy is anything but..